Appearance
Sale analytics
Once buyers start visiting your public sale page, the Analytics tab shows you exactly how your sale is performing. Open your sale and select the Analytics tab to see the numbers.
What you'll see
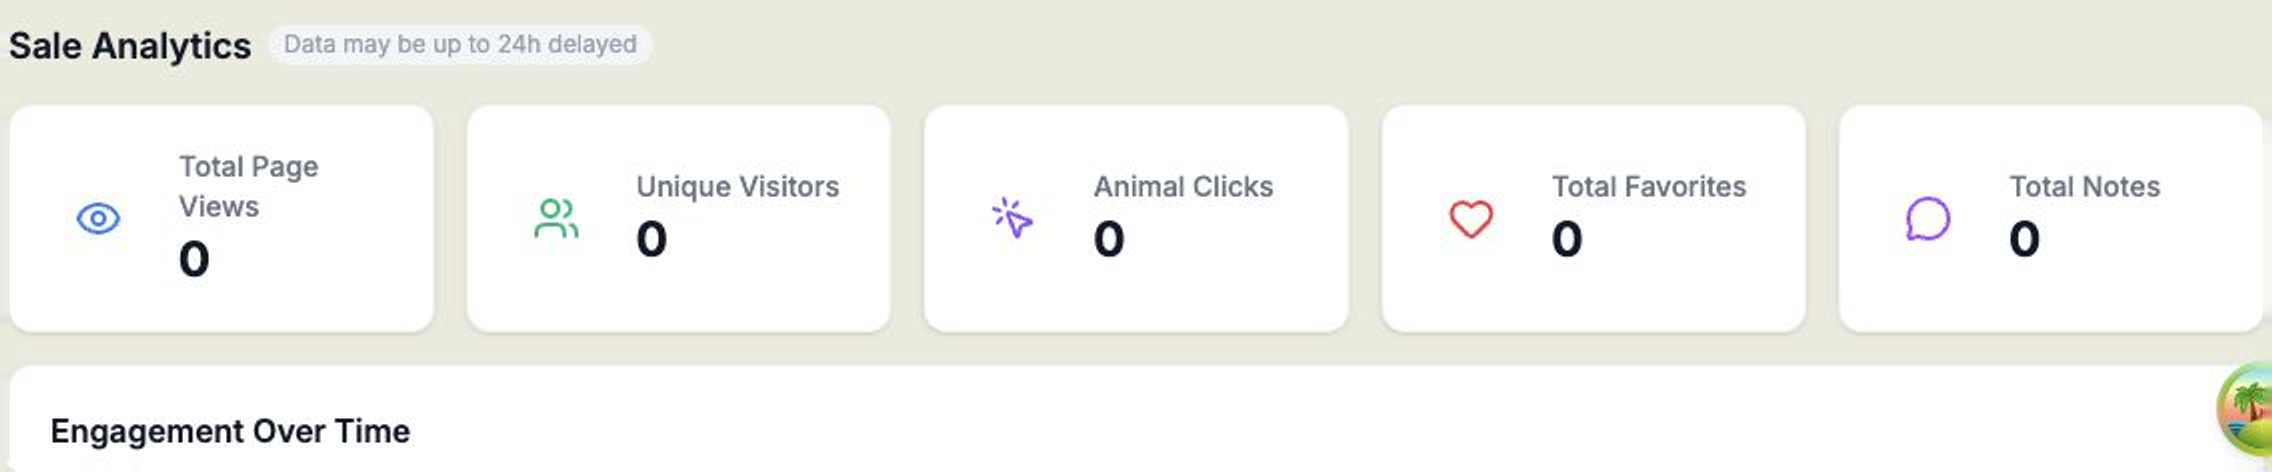
The top of the tab shows your key figures at a glance:
- Total Page Views — how many times your sale page has been viewed.
- Unique Visitors — how many different buyers have visited.
- Animal Clicks — how often buyers have opened individual lots.
- Total Favorites — how many times buyers have favourited an animal.
- Total Notes — how many notes buyers have left.
Below the headline figures you'll find more detail:
- Engagement Over Time — a chart of activity across the lead-up to your sale.
- Animal Interest Ranking — a table showing which lots are drawing the most clicks, favourites, and notes, so you can see your standouts.
- Recent Notes — the latest notes buyers have left.
- Traffic Sources — where your visitors are coming from.
- Device Breakdown — whether buyers are browsing on desktop or mobile.
Good to know
The figures here populate once buyers start visiting your public sale page — so a brand-new sale will look empty until you've shared the link and buyers begin browsing.
Data can be up to 24 hours behind
Analytics may be up to 24 hours delayed, so don't worry if the very latest visit isn't reflected straight away.