Appearance
Sales map
Understand your market reach at a glance — the Sales map plots your sales geographically so you can see where your buyers are and which regions bring in the most revenue.
Open Analysis from the left-hand menu, then choose Sales Map.
Steps
- Open Analysis, then Sales Map.
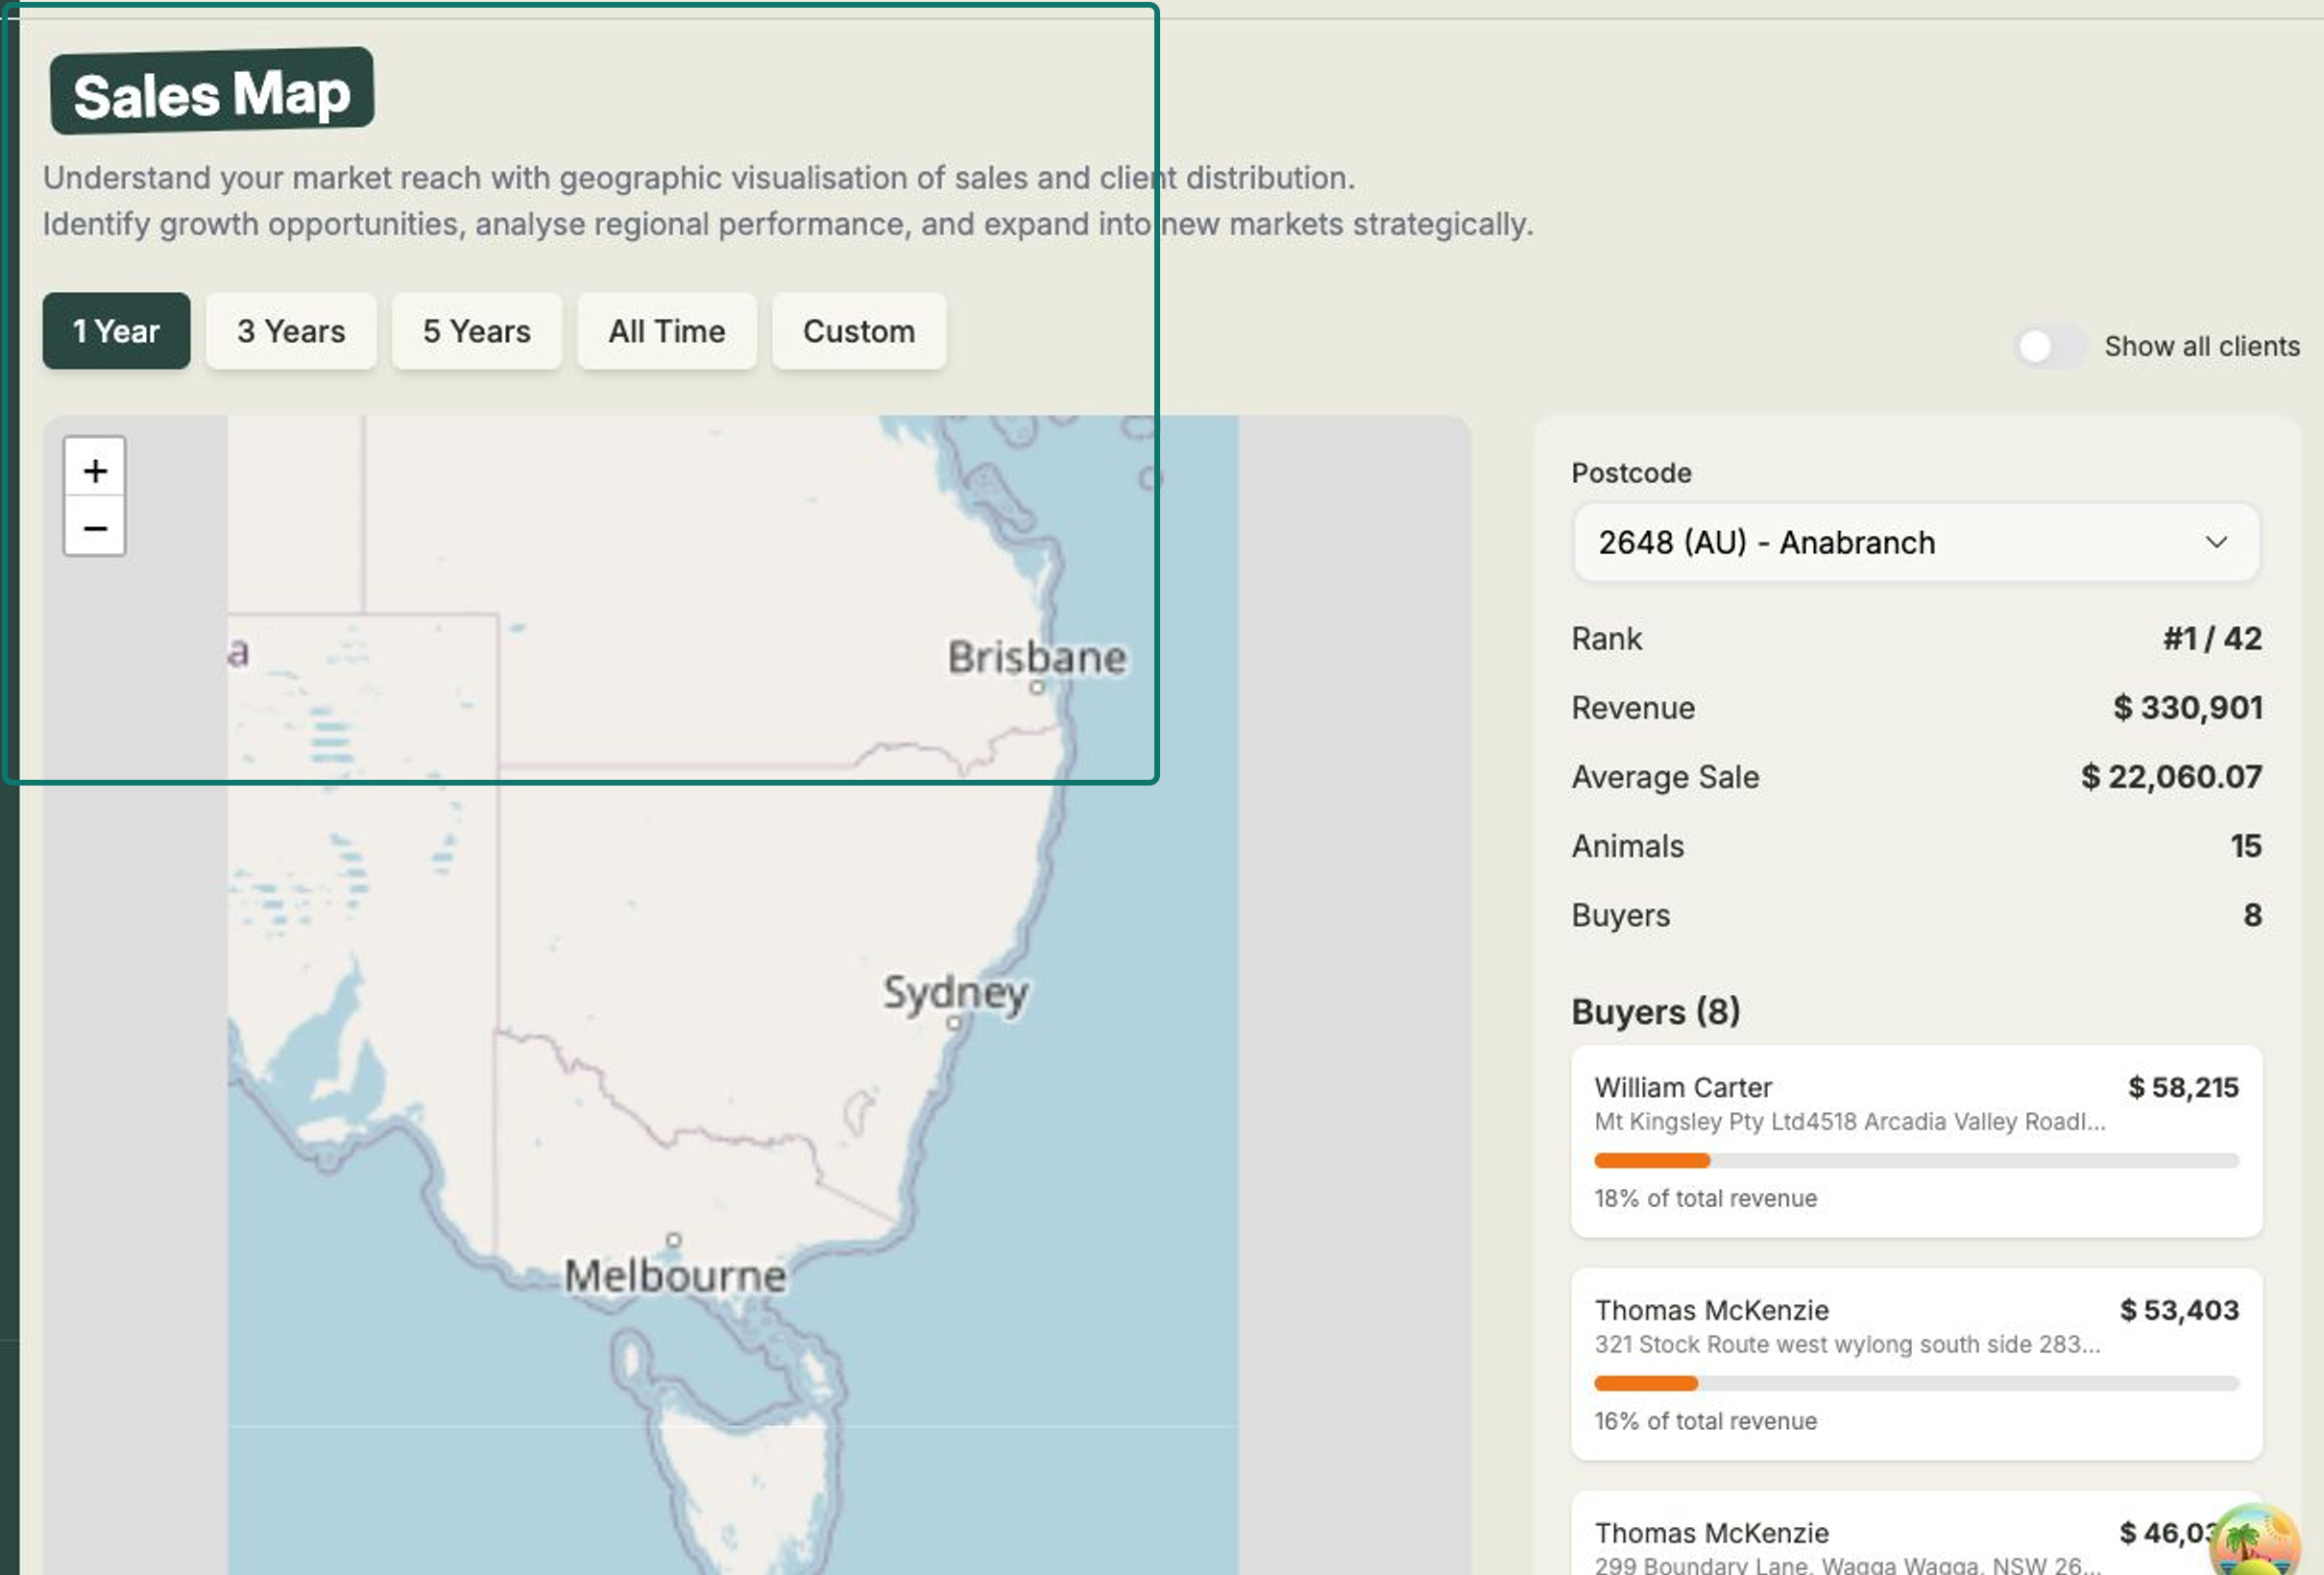
- Choose a Time period — 1 Year, 3 Years, 5 Years, All Time, or Custom for your own date range.
- Read the map — postcodes are shaded on a Lowest to Highest revenue heat scale, so the busiest regions stand out. Use Zoom in and Zoom out to move between an overview and a closer look.
- Turn on Show all clients to plot every client, not just the postcodes that have generated sales.
- Browse the ranked Postcode list alongside the map to see your regions ordered by revenue.
Look inside a postcode
Select a postcode from the list to open its detail. You'll see its Rank (for example #3 of all your postcodes), total Revenue, Average Sale, the number of Animals sold, and the number of Buyers.
Below that, the Buyers breakdown lists each buyer in that postcode — their name, address, the revenue they've contributed, and the percentage of that postcode's total revenue they represent.
Spot your next opportunity
Use the heat shading to find strong regions to focus your marketing on — and quieter ones nearby that might be worth expanding into. Keeping client addresses accurate keeps this map reliable.