Appearance
Sire & dam analysis
See which sires, dams and breeding pairs produced your most valuable progeny at sale — and use that to optimise your breeding program.
Open Analysis from the left-hand menu, then choose Sire & Dam.
Steps
- Open Analysis, then Sire & Dam.
- Choose a Time period — 1 Year, 3 Years, 5 Years, All Time, or Custom to set your own date range.
- Pick what you want to rank: Best Sire, Best Dam, or Best Sire-Dam (the best-performing breeding pairings).
- Choose the metric to measure by: Revenue, Avg Revenue, or Number of Sales.
- Use Top N to show the Top 10, Top 25 or Top 50, and Sort By to order the list to suit you.
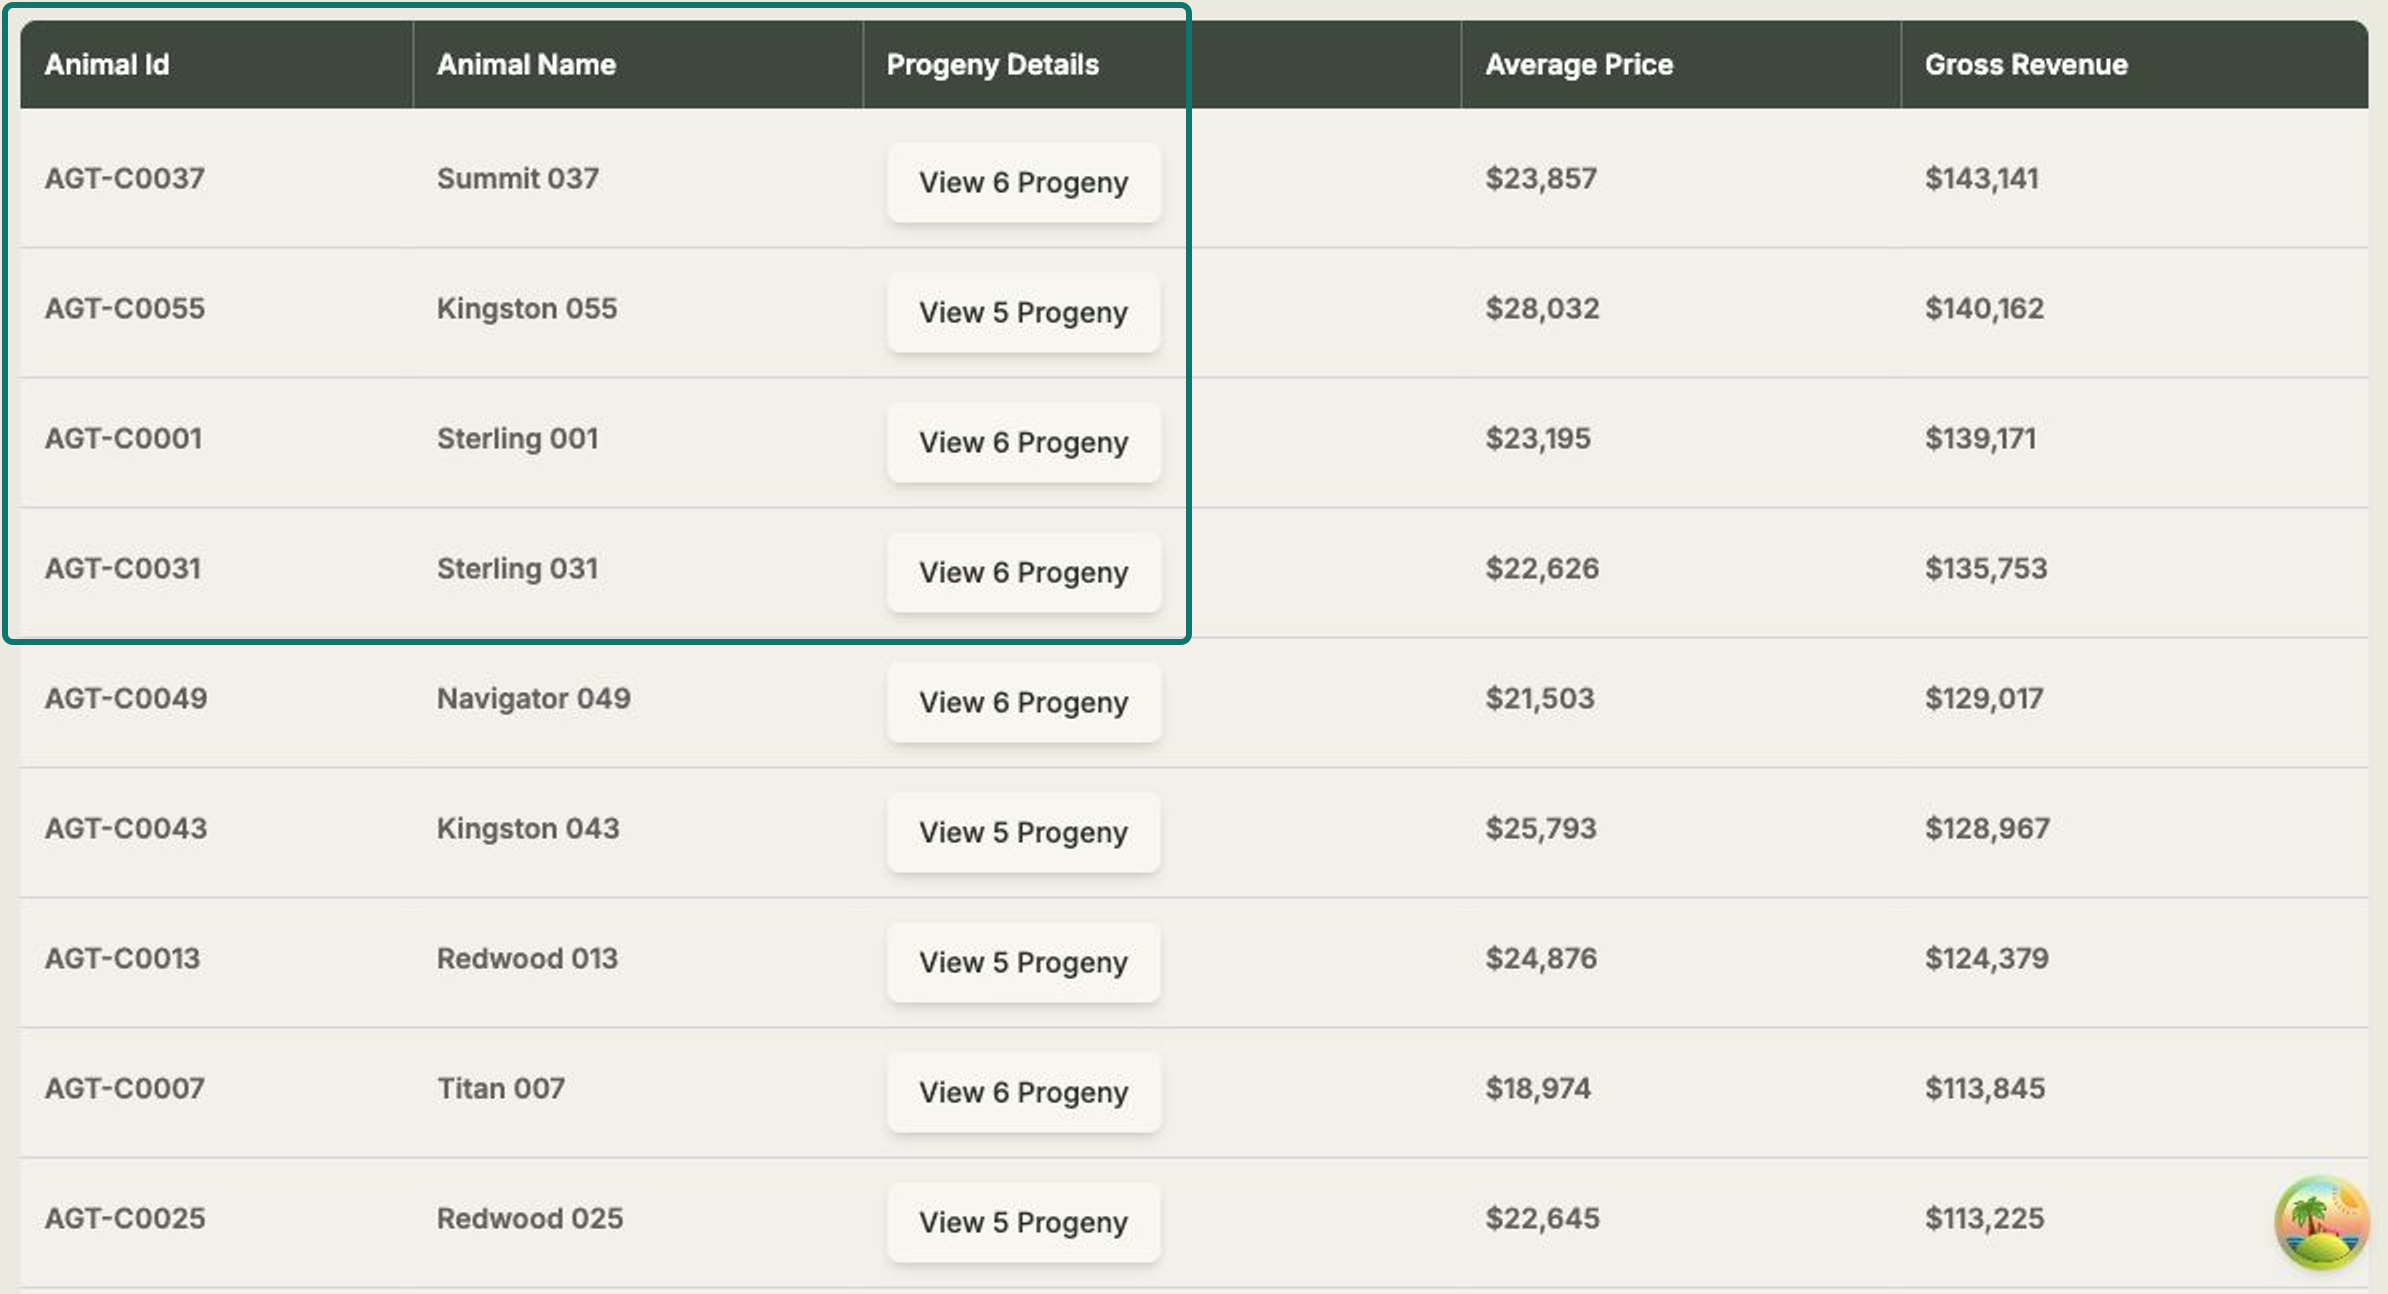
- Read the table — each row shows the Animal Id, Animal Name, Progeny Details, Average Price and Gross Revenue.
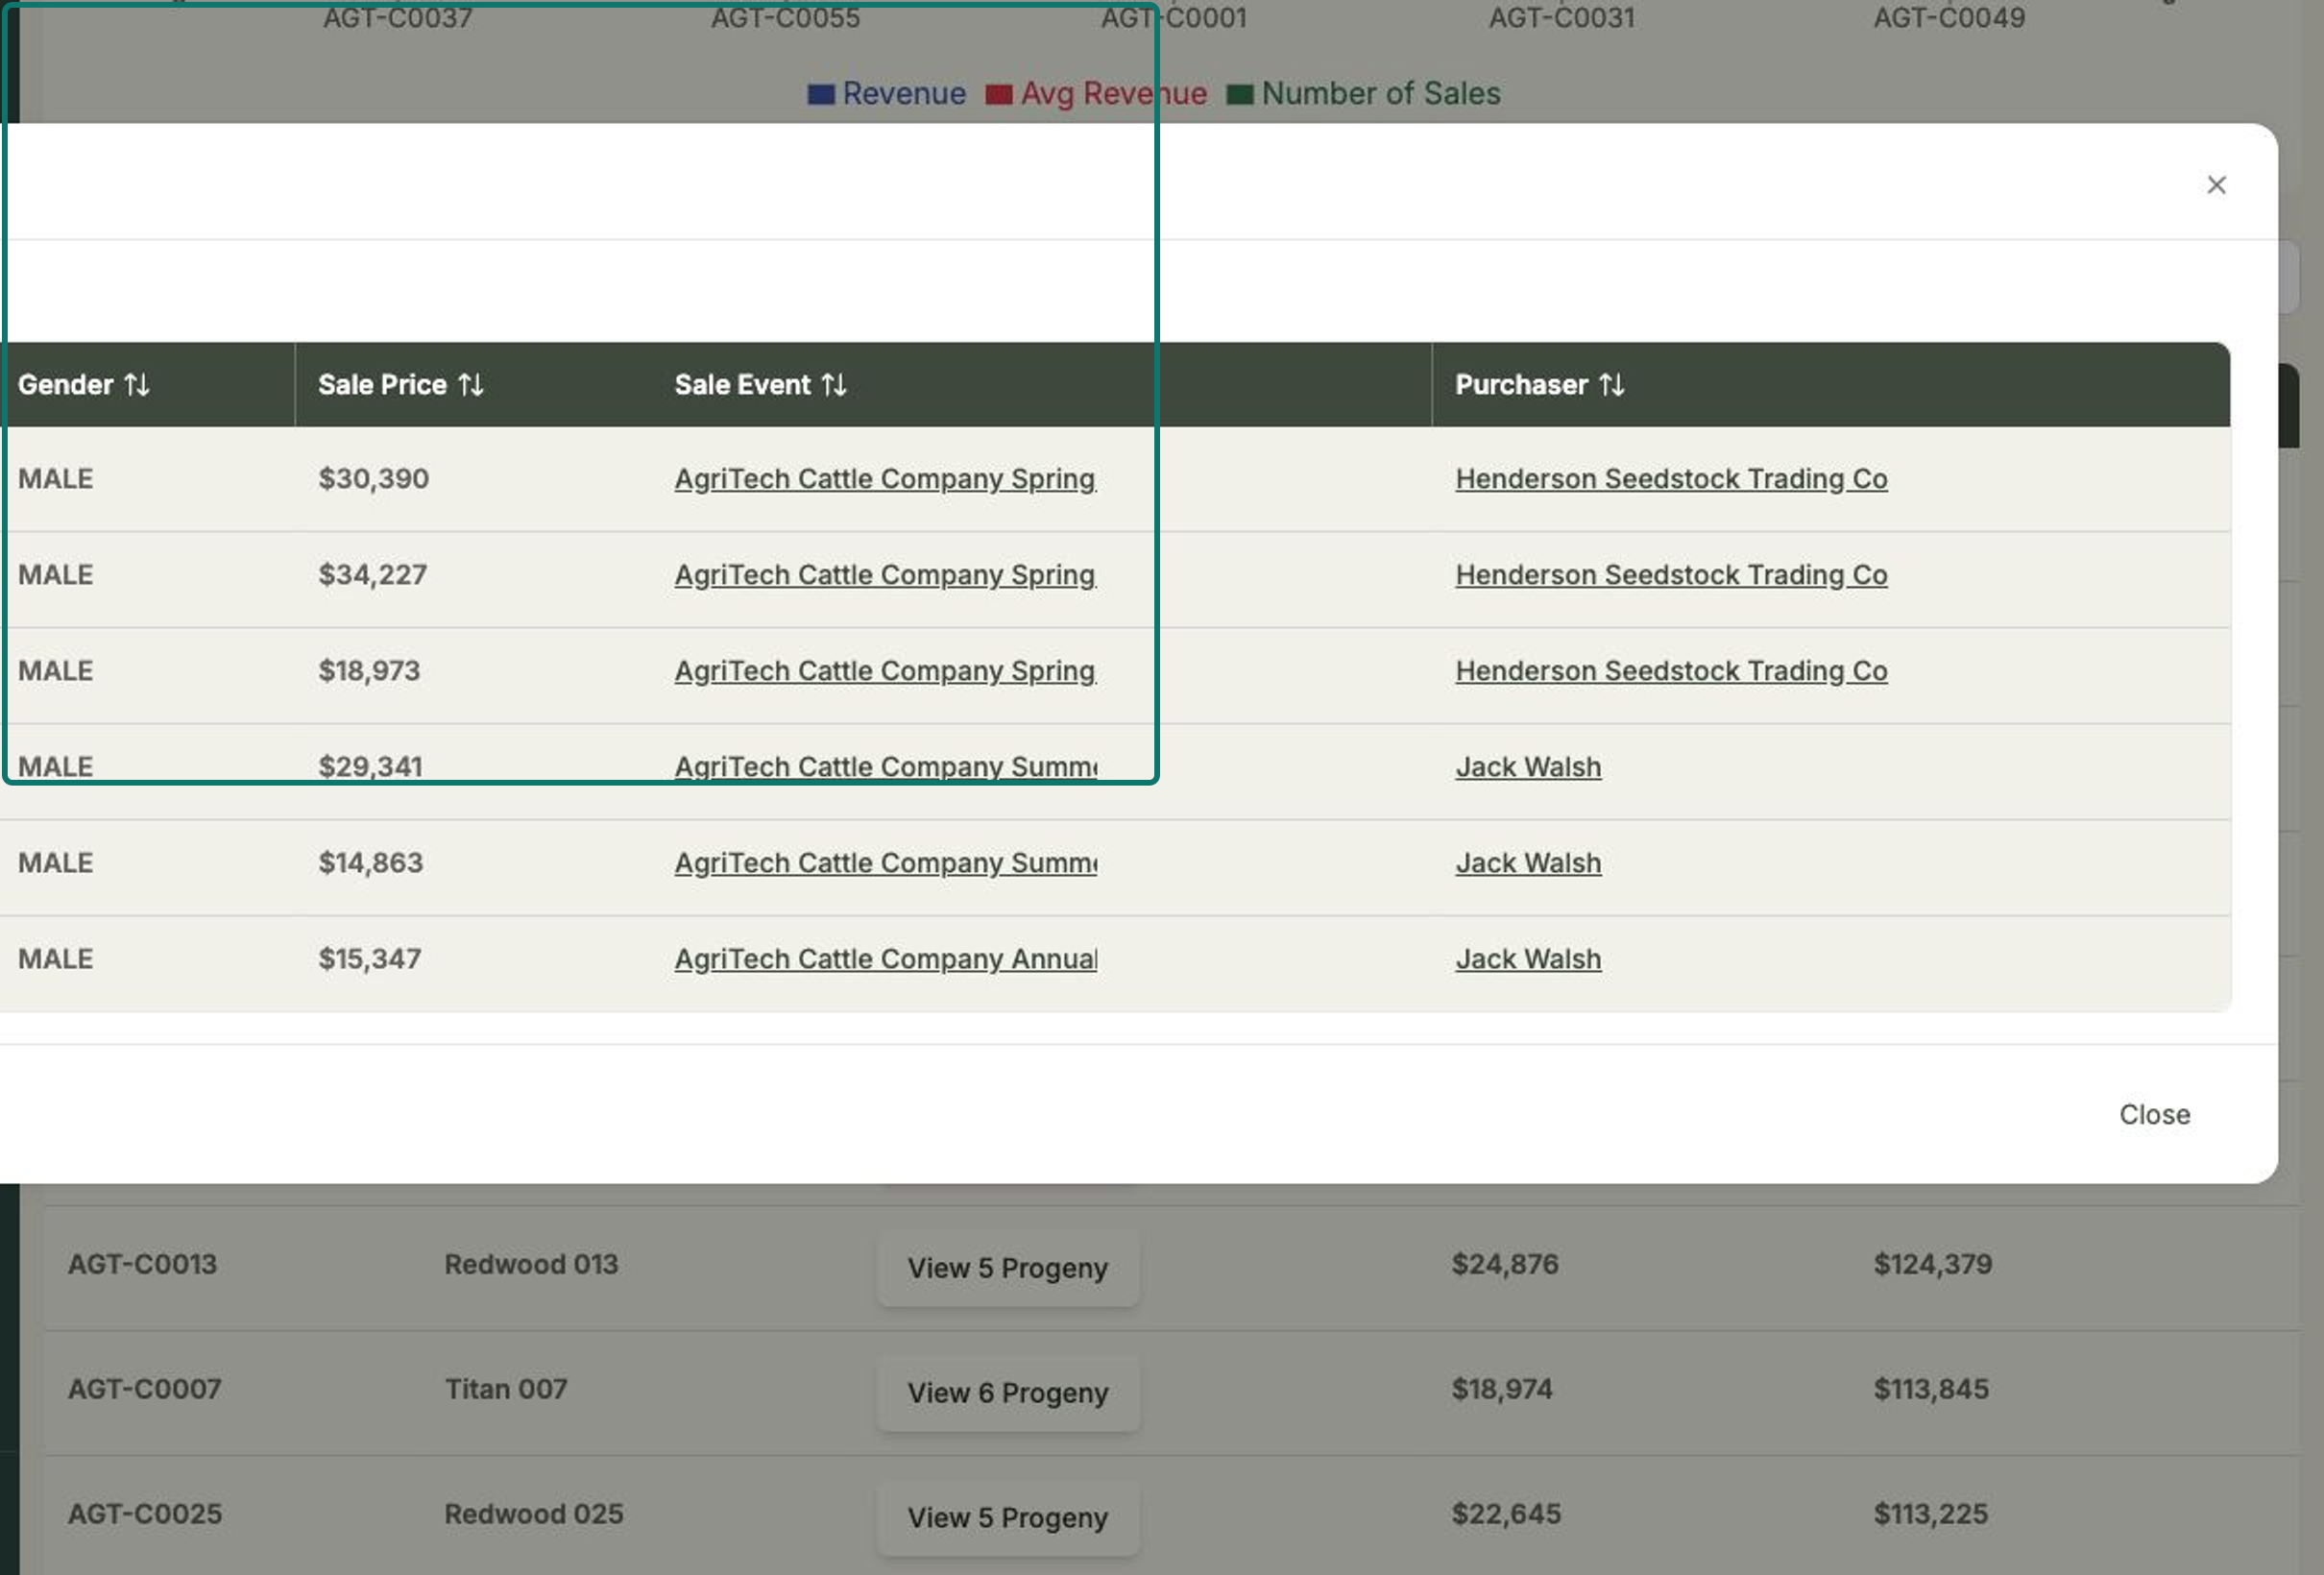
See the progeny behind a result
In the Progeny Details column, select View Progeny to drill down into the offspring behind that sire, dam or pairing — so you can see exactly which animals drove the result.
Read it your way
The view toggle (Best Sire / Best Dam / Best Sire-Dam) and the metric toggle (Revenue / Avg Revenue / Number of Sales) work together. For example, switch to Best Dam and Avg Revenue to find the dams whose progeny fetch the highest average price, rather than the highest total.