Appearance
Your dashboard
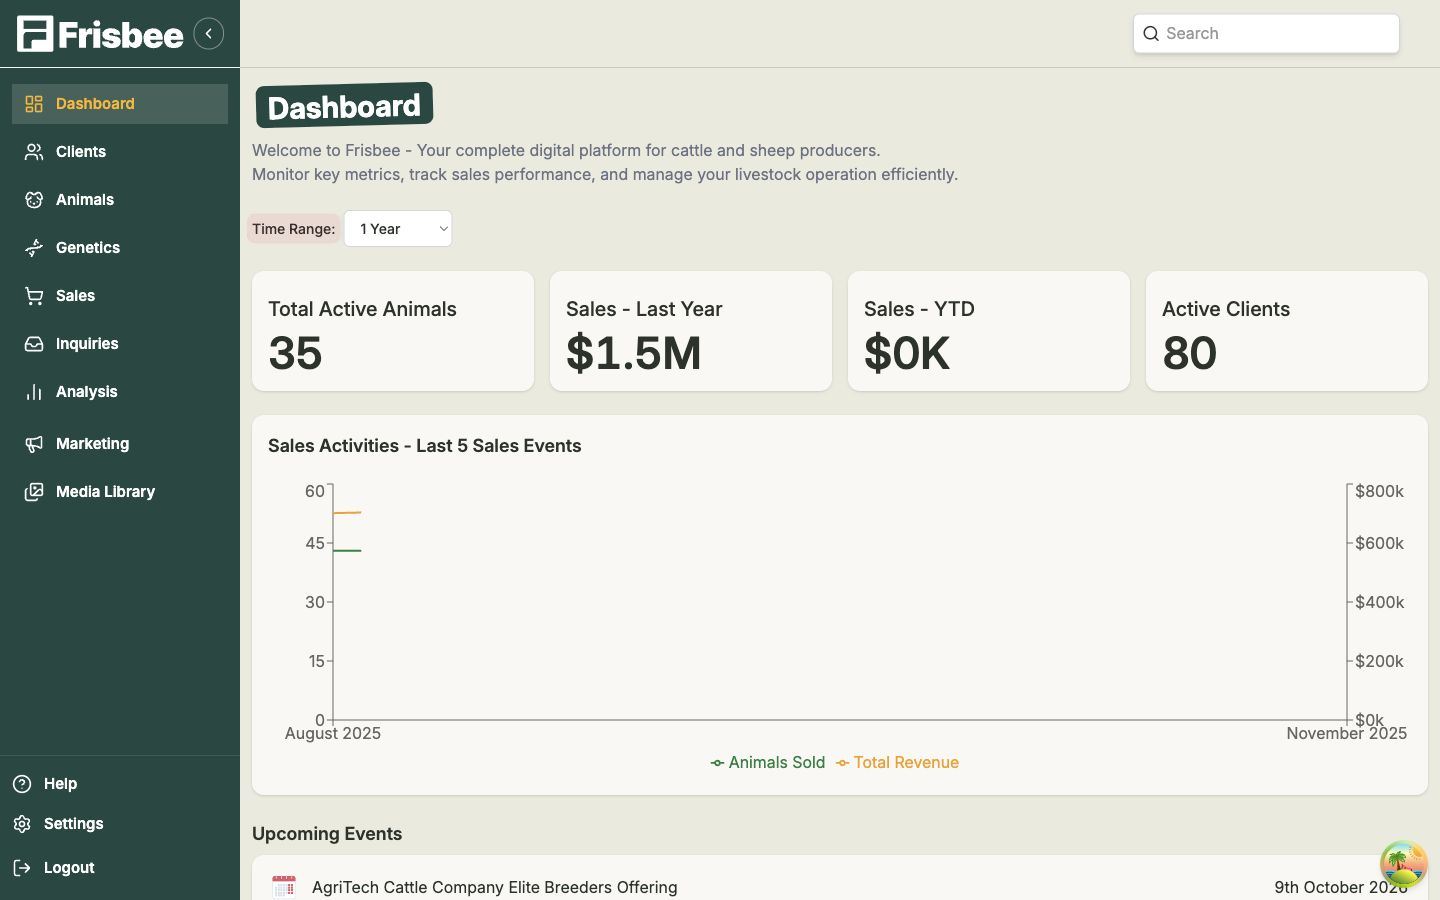
Your dashboard is the first thing you see after logging in — a friendly overview of your operation, with the numbers that matter most front and centre.
What you'll see
- Time Range — choose the period your dashboard covers: 6 Months, 1 Year, 2 Years, 5 Years or All Time. Everything updates to match.
- KPI cards — quick headline figures: Total Active Animals, Sales - Last Year, Sales - YTD and Active Clients.
- Sales Activities - Last 5 Sales Events — a chart of animals sold and total revenue from your most recent sales.
- Upcoming Events — sales and dates coming up.
- Best Sales Events — your top-performing sales.
- Top Clients — your most valuable buyers.
Many of these are clickable — select a sale, event or client to jump straight to its full record.
Finding things quickly
Use the Search box at the top of the page to look up an animal, client or sale at any time, from anywhere in the app.
Change the time range to spot trends
Switch the Time Range between 1 Year and All Time to compare a recent snapshot against your whole history.